Synopsis
A new analysis drawing on 570 studies with data covering 38,700 commercial farms shows dramatic variation both worldwide and within-region in the environmental impact across all major foods, but confirms that beef in particular and animal products in general are responsible for the greater part of food’s impact on earth, which adds up to 31% of global warming emissions (including non-food agriculture), and 43% of ice- and desert-free land. Supplementary material available for free (and is very comprehensive), while the main article is for subscribers only (here).
Poore, J., & Nemecek, T. (2018). Reducing food’s environmental impacts through producers and consumers. Science, 360(6392), 987-992.
Overview and Highlights
Poore and Nemecek recently published a paper in Science that has justly received a decent amount of media attention. This is a remarkably comprehensive work that compiled data from life cycle assessments in 570 published papers (from 2000 to 2016), to cover about 38,700 commercial farms across 119 countries. Environmental impact was assessed across five categories:
- Greenhouse gas (GHG) emissions: measured in kgCO$_2$-equivalent ( kgCO$_2$e) per nutritional unit, generally chosen as 100 g protein for animal products, 1,000 kcal for staple grains and tubers, liters for oilseed, and kg for horticultural and sugar crops.
- Land-use (m$^2$/year).
- Acidification potential (gSO$_2$-equivalent).
- Eutrophication (g PO$_4^{3–}$-equivalent).
- Water use weighted by water scarcity.
Major conclusions included:
- 43% of the globe’s ice- and desert-free land is used for agriculture, and the food/agriculture system (upstream of the consumer) is responsible for roughly 31% of global GHGs. There is marked variation in the impact of different farms.
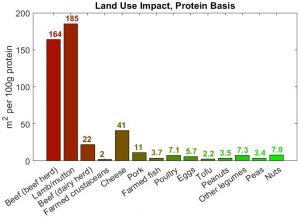
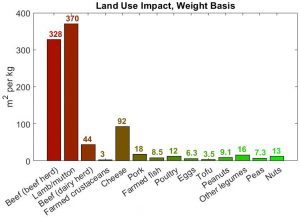
- Beef from beef herds (i.e. cattle raised only for beef without any dairy co-production, and the dominant model in the United States) has by far the highest GHG and land use impact. Beef from dairy herds is still higher impact than almost all other foods.
- Dairy is much better than beef, but somewhat worse than most other animal products.
- Even low-impact animal products (eggs, poultry meat, some farmed fish) have a much higher impact than vegetable sources of protein (e.g. soy, legumes, peanuts, or grains).
- Animal products provide 37% of protein and 18% of calories, but are responsible for 83% of global farmland and 56-58% of food-related emissions.
- A global dietary shift to a completely animal-free diet would reduce food-related GHGs by ~49% and farmland by ~76%.
- Just eliminating beef (globally) would still reduce food GHGs by 33%.
- A dietary shift away from all animal products in the US, where per capita meat consumption is thrice the world average, could reduce food emissions 61-73%.
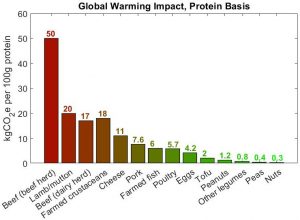
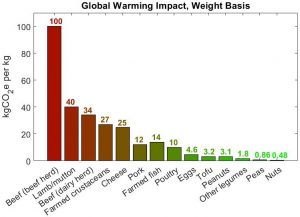
Using data reported in Figure 1, I have re-plotted below the mean impacts of foods whose major nutritional role is to provide protein, on both a kgCO$_2$e per 100g protein and kgCO$_2$e per kg of product weight basis. Similar plots are given for land use.


Overall, beef and farmed crustaceans (e.g. shrimp) are the highest impact, while of animal products, eggs and poultry are generally best.
Note that the above results are global averages. The per-unit GHG impact of animal products in the intensive, industrialized production systems of America are likely to be appreciably lower, perhaps by a factor of two, but the qualitative rankings (and gross quantitative ratios) should hold for US consumers.
It is noteworthy that not only was there great variability in impacts between producers for the same product, practice changes for reducing impacts varied between producers, many practice changes were expected to have little net impact or incurred trade-offs between different axes of environmental harm. For crop management the following broad conclusions could be drawn (see Figure S6 of the supplementary material):
- Diversified cropping rotations (e.g. increased cropping intensity via early-maturing varieties and reduced fallow time) can modestly decrease both land use and GHGs.
- Organic cropping increases land requirements but has an equivocal GHG effect.
- Protected (e.g. greenhouse) crops reduce land requirements, but have the potential to markedly increase GHGs.
For animal systems, broad conclusions include:
- Improving degraded pasture positively affects both land use and GHGs.
- Feedlot finishing reduces land use slightly.
- Organic animal systems use much more land, but are similar to conventional on a GHG basis,
See Also
Steinfeld, H., Gerber, P., Wassenaar, T., Castel, V. Rosales, M., de Haan, C. (2006). Livestocks’ long shadow: environmental issues and options. Food and Agriculture Organization of the United Nations (FAO), Rome. http://www.fao.org/docrep/010/a0701e/a0701e00.HTM
Gerber, P. J., Steinfeld, H., Henderson, B., Mottet, A., Opio, C., Dijkman, J., Falcucci, A. & Tempio, G. (2013). Tackling climate change through livestock – A global assessment of emissions and mitigation opportunities. Food and Agriculture Organization of the United Nations (FAO), Rome. http://www.fao.org/docrep/018/i3437e/i3437e00.htm
Excerpt on food and agriculture.
Why include non-food agriculture to the GHG attribution of the food sector? On page 1 of their article, Nemecek and Poore note: “Today’s food supply chain creates ~13.7 billion metric tons of carbon dioxide equivalents (CO2eq), 26% of anthropogenic GHG emissions. A further 2.8 billion metric tons of CO2eq (5%) are caused by nonfood agriculture and other drivers of deforestation (17).”
Their reduction due to dietary shift is arguably conservative. Table S16 allows for an additional reduction of 5.50 billion tons of CO2 resulting from sequestration of carbon on abandoned pasture, based on estimates from Stehfest et al. (2009) and an amortization period of 20 years.
Pingback: 2018 | Aesthetic Complexity
“Dairy is much better than beef, but somewhat worse than most other animal products.”
Could someone explain why or how this is the case?
Pingback: Shifting to a Vegan Diet - Good for Health and Environment – Altering Climate
It’s like on a badness scale most other would come in at about 5 with dairy at 6 and beef at 10.
It doesn’t seem to account for beef production that utilises land that’s unsuitable for anything else though.
Pingback: The Small Shopping List Tweak to be Healthier & Greener - Low CO2 Diet
Pingback: Pathways to a Post-Capitalist World | One Home Planet