
Part the First: Brief Background on Emissions Factors
Electricity generation accounts for almost one-third of US territorial greenhouse gas emissions, and the average US residence consumes just under 11,000 kilowatt-hours (kWh) electricity per year (in addition to other fuels, such as natural gas). Thus, it is essential to understand the impact of electricity use, and especially how changes in use at the household level will affect emissions.
I plan on publishing a series of posts that show the generating mix, physical locations of fossil generating stations, grid-average emissions factors, and estimated marginal emissions factors for at least some (and hopefully all) EPA eGRID subregions, i.e. regional electrical grid interconnects for electricity distribution. However, it takes a decent amount of time and effort to download and process hourly data for the whole US, so I will begin this series with some general background on emissions factors (which has already been covered to some degree in my post on my rooftop solar experience in Arizona), followed by a more detailed examination of the Western Electricity Coordinating Council (WECC) region, which is composed of four EPA eGRID subregions. EPA eGRID subregions in the continental US are shown graphically in Figure 1, while the WECC region and its component subregions are highlighted in Figure 2.
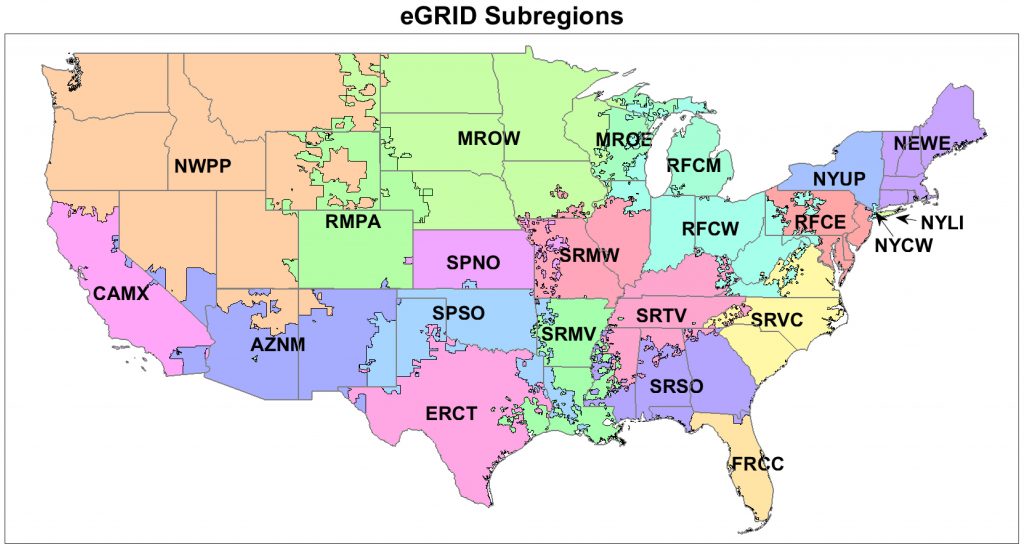
Figure 1. Map of all EPA eGRID subregions in the continental US. Map drawn in MATLAB using shapefiles available here.
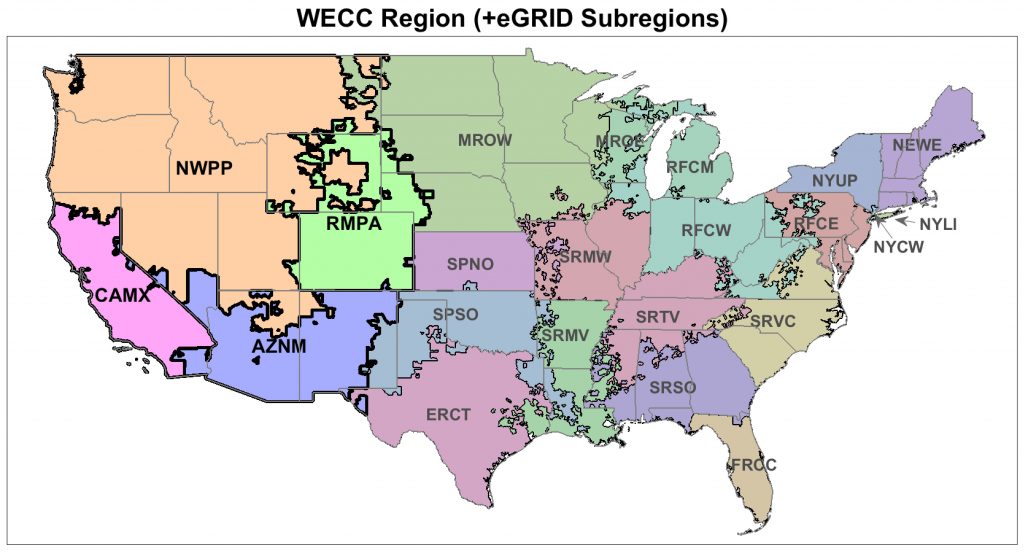
Figure 2. Map of EPA eGRID subregions highlighting the four subregions that make up the US portion of the WECC region.
Now, the generating mix varies widely across the US, with coal generation dominant in much of the Midwest and South, while natural gas, nuclear, and some renewables are more important in other regions. Thus, the grid-average emissions-factor (EF), which we derive simply as the ratio of CO$_2$-equivalent (CO$_2$e) emissions (in kg) that result from all electricity generation, to the number of kWh generated,
$\text{Grid-Average EF} = \frac{\text{Total CO$_2$e}}{\text{Total kWh}} \text{ (kgCO$_2$e/kWh)}$,
varies across regions. Also note that with the grid-average EF, we average across multiple power plant types, including those that have no emissions at all at the point of generation, such as nuclear or wind. Just looking at the emissions from the smokestacks gives a direct EF, while including the upstream emissions embodied in fuel provision, plant construction, etc. gives a direct + indirect, or lifecycle EF. The latter is more appropriate for carbon footprinting purposes.
Finally, most renewables differ from fossil generation in that fossil generators are dispatchable: new generating units can be brought online to meet variations in demand. It follows that changes in power demand almost exclusively affect fossil generation, and so marginal changes in electricity consumption typically affect fossil generation. Thus, the marginal emissions factor is generally more relevant to understanding how both energy conservation or new loads will affect greenhouse gas emissions (at least in the relatively short-term). Upstream emissions embodied in fuel extraction and conveyance can (and should) be incorporated into a lifecycle marginal emissions factor.
As general rules of thumb, we have the following approximate lifecycle EFs for different generating sources:
- Coal: EF $\approx$ 1.1 kgCO$_2$e/kWh (90% from direct combustion). Thus, generating 11,000 kWh (approximate yearly electricity use for an average household ) from coal would yield about 12,000 kgCO$_2$e, i.e. 12 metric tonnes CO$_2$e.
- Natural gas: EF $\approx$ 0.6 kgCO$_2$e/kWh (~70% from direct combustion). Generating 11,000 kWh with gas thus generates on the order of 7 tonnes CO$_2$e.
- Nuclear and most renewables: EF $\approx$ 0.02-0.15 kgCO$_2$e/kWh (all upstream, i.e. no combustion emissions), depending upon the source. Biomass is an exception and probably has a relatively high lifecycle EF due to altered forest carbon dynamics.
Note that, because of transmission and distribution (T&D) losses, one kWh consumed corresponds to slightly more than one kWh generated, and thus the EF for electricity use is slightly higher than the EF for generation.
Now, for coal, the majority of CO$_2$e emissions occur at the smokestack, with the major source of upstream emissions coal mine methane (mining operations and coal transport are the other two significant sources). For natural gas generation, upstream methane leakage is by far the most important non-combustion CO$_2$e source (methane is 36 times as potent a greenhouse gas as CO$_2$ over a 100-year timeframe). Calculations for determining upstream coal and gas emissions, given power plant thermal efficiency, are presented in the appendix of my prior post. Oil extraction and refining is a major source of upstream emissions for fuel oil, but oil is a trivial electricity feedstock in the west.
For non-fossil generating sources, major upstream emission sources include methane from vegetation decay in hydropower reservoirs, uranium mining and enrichment for nuclear energy, greenhouse gas emissions from geofluids for geothermal power, and altered carbon dynamics for biomass. Figure 3 summarizes approximate lifecycle EFs for major generating sources (from Chapter 4 of A Fair Share).
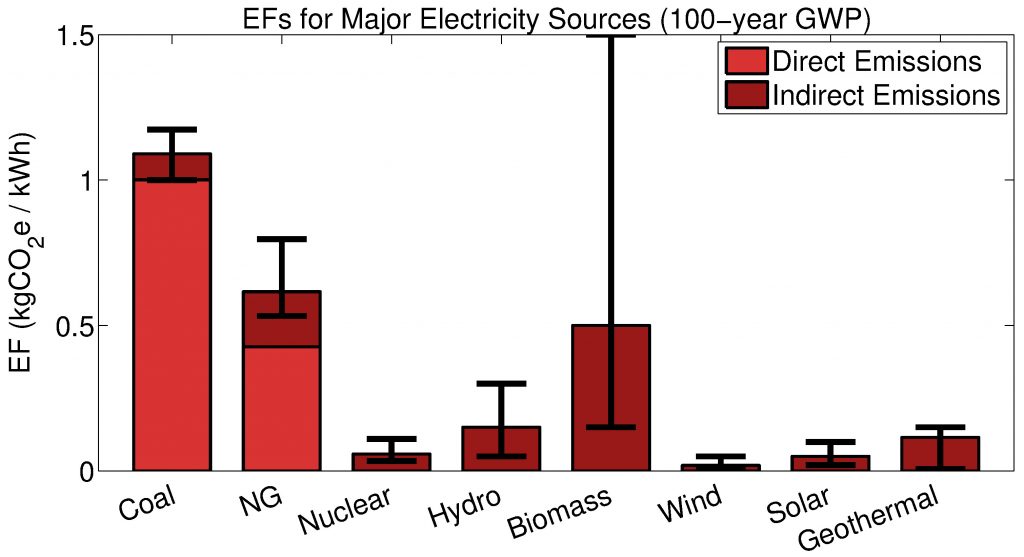
Figure 3. Approximate lifecycle (direct + indirect) EFs for major electricity sources (in the US). Error bars reflect my own assessment of the likely ranges, with uncertainty mainly due to uncertainty/variability in upstream emissions. Numerically, and for typical power plant thermal efficiencies, my central estimates for upstream emissions are 89 gCO$_2$e/kWh for coal, 189 gCO$_2$e/kWh for NG, 58 gCO$_2$e/kWh for nuclear, 150 gCO$_2$e/kWh for hydropower, 500 gCO$_2$e/kWh for biomass, 19 gCO$_2$e/kWh for wind, 50 gCO$_2$e/kWh for solar, and 115 gCO$_2$e/kWh for geothermal power.
To determine grid-average EFs, I use data from the EPA’s eGRID program, which gives unit-level electricity generation and emissions data for all power plants that provide energy to the US electrical grid, and regional grid emissions factors are determined at the level of eGRID subregions. This database only reports combustion (smokestack)-level emissions, and so I modify results using estimated upstream emissions for each generating class, both fossil and non-fossil/renewable.
To determine marginal emissions, I employ a modification of the methodology of Siler-Evans et al. [1], which uses hourly emissions data from all fossil generating plants greater than 25 MW across the US, publicly available from the EPA. In my prior post on rooftop solar in Arizona, I outlined the method, which, in brief, entails taking the difference between the minimum and maximum CO$_2$ emissions for each day, and then dividing by the difference in power generated (the change in gas and coal generation between the minimum and maximum is also tracked). I also use this data to determine the thermal efficiency for each generating unit and thus the upstream emissions per kWh (of electrical energy) for natural gas, coal, and fuel oil.
Part the Second: Generating mix in the WECC region
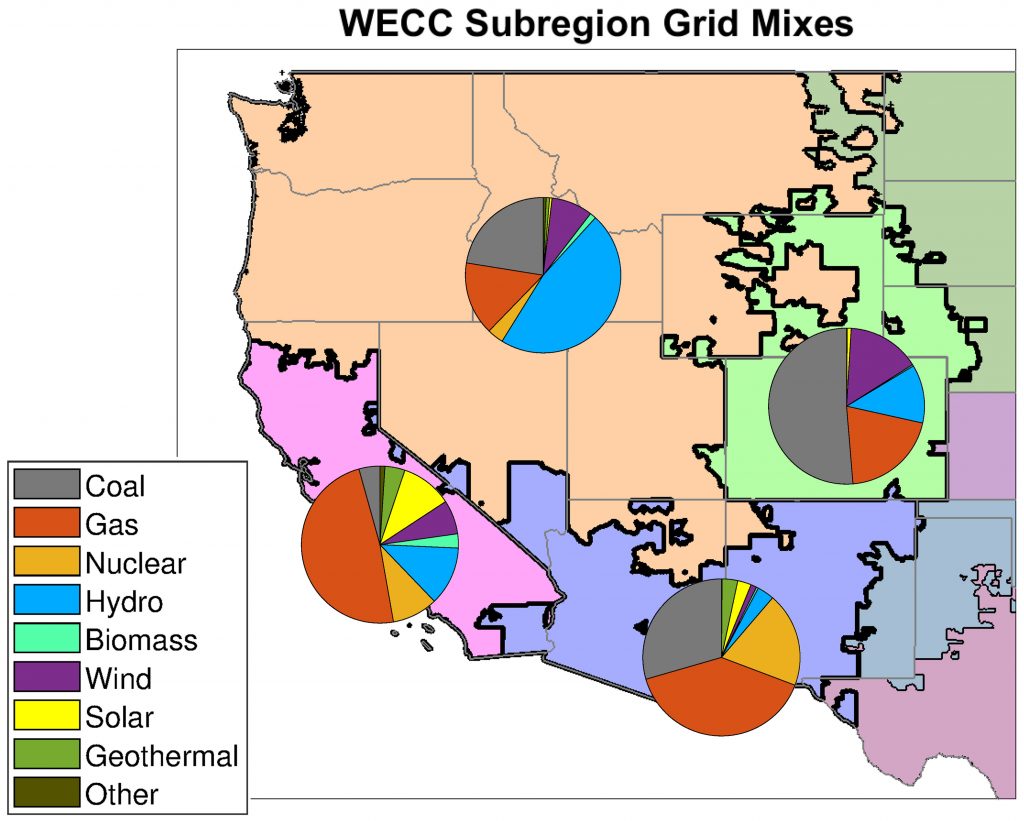
Figure 4. Generating mixes for the four subregions making up the WECC region, based upon the 2016 eGRID database.
Figure 4 shows the overall grid mixes (for 2016, using eGRID data) across the four eGRID subregions that make up the entire WECC region, and we see that the RMPA region (mainly Colorado and parts of Wyoming and Nebraska) is highly coal reliant, the AZNM region uses a broader mix, and further west the mix is generally cleaner.
Looking just at fossil generation, coal is the major source more northerly and easterly, while gas generation is especially important in California (in 2017, all fossil generation in the CAMX region was from natural gas). Using data available from the EPA’s Air Markets Program Data (AMPD), Figures 5 and 6 show all fossil generating stations in the WECC region, with each point scaled in proportion to total annual electricity generation (in 2017). There is a handful number of large coal plants spread throughout (mainly) the western portion of the region, with these located relatively far away from major population centers, while a much larger number of smaller gas plants cluster around population centers.
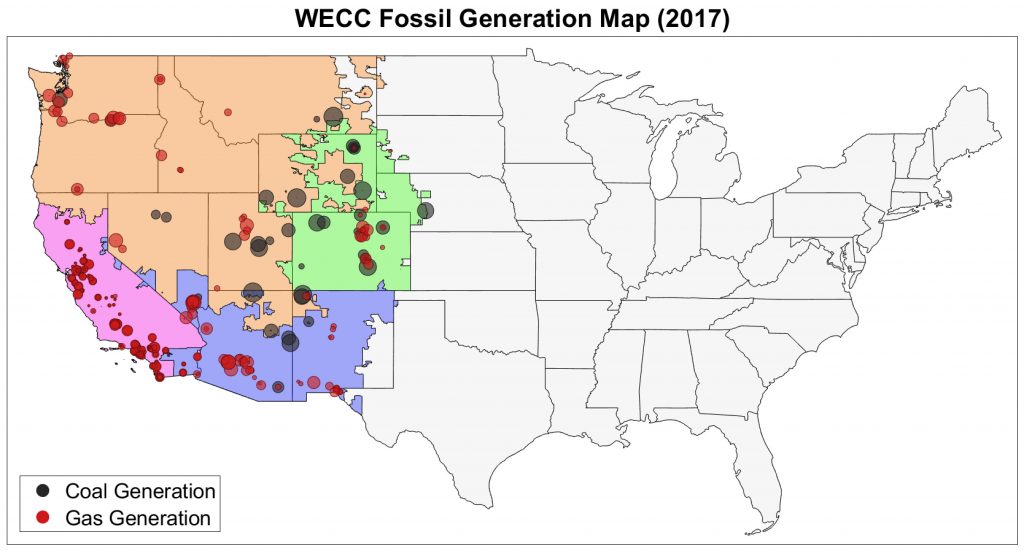
Figure 5. All fossil generating units in the WECC region, with point size scaled to annual generation for 2017.
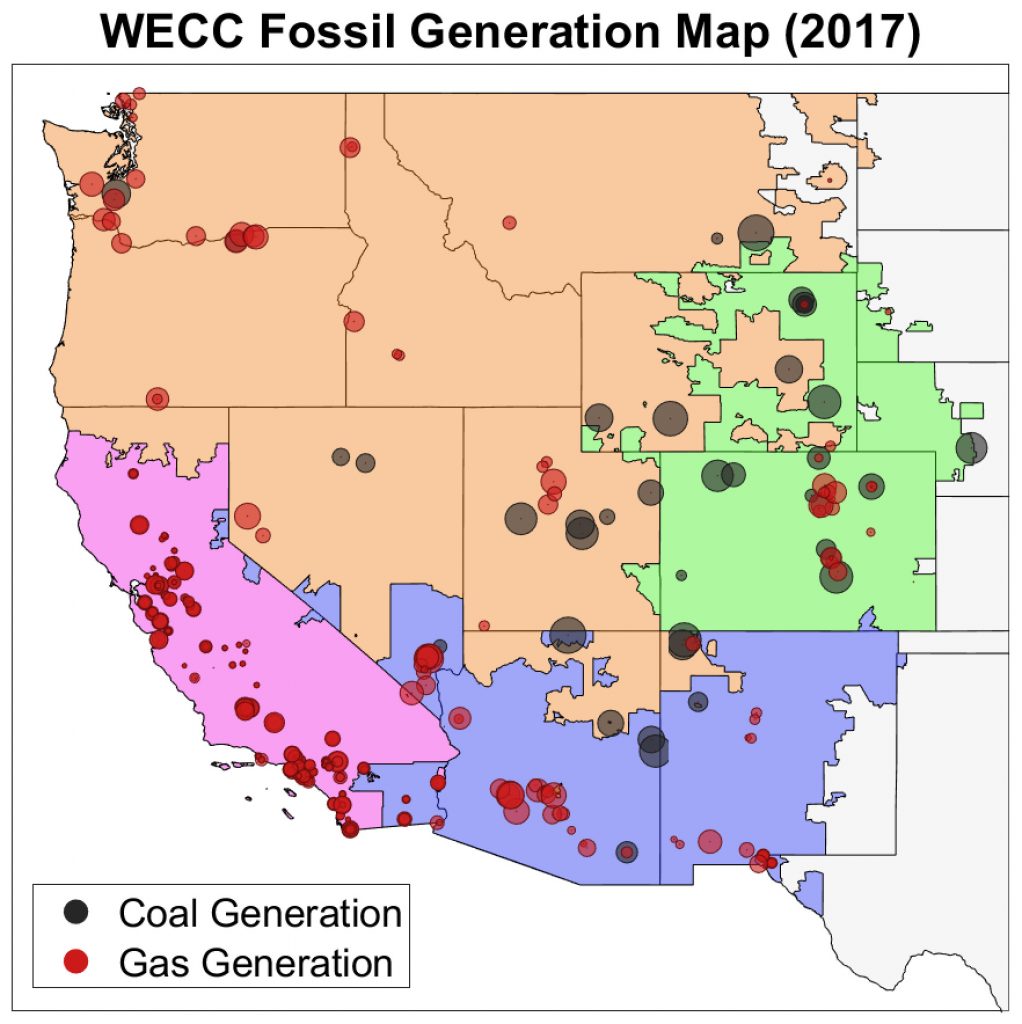
Figure 6. Zoomed version of Figure 5, showing all fossil generating units in the WECC region, with point size scaled to annual generation for 2017.
Part the Third: Grid-average, fossil, and marginal generation in the WECC region
Daily fossil generation across the WECC region is plotted in Figure 7, along with the estimated daily lifecycle fossil EF. Figure 7 also shows how the marginal generating mix varies with each day, and the approximate daily marginal EF. As can be seen, the marginal mix is more gas-heavy than the overall fossil mix (gas plants generally have a greater ability to load-follow, and peak loads are often met with gas combustion turbines), and thus the marginal EF is lower than the average fossil EF, but still larger than the grid-average EF.
Finally, the grid-average, fossil, and marginal generating mixes and associated lifecycle EFs are summarized in Figure 8. Note that a 4.23% T&D loss is factored in to distinguish between EFs for electricity generated and delivered (i.e. used).
In sum, Figure 8 tells us:
- The average carbon footprint of 11,000 kWh in the WECC region is about 5.5 tonnes CO$_2$e, on the basis of grid-average electricity.
- Adding or subtracting 11,000 kWh, at the margin, would change greenhouse gas emissions by around 8.75 tonnes CO$_2$e.
These figures derive from a lumped average across four large subregions, and therefore in a subsequent post, the emissions factors for each subregion will be presented in detail.
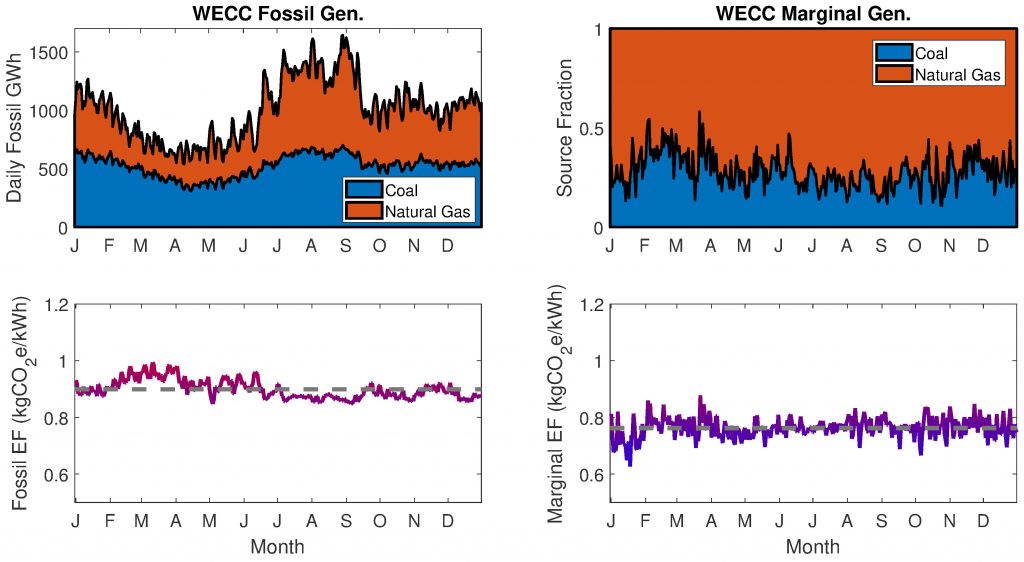
Figure 7. The top left panel gives daily fossil generation (coal and gas) over 2017 in the entire WECC region, and the associated lifecycle EF is plotted beneath. On the right, the fraction of new generation coming from coal or gas over daily changes in generation (top) is used to approximate the marginal EF (bottom).
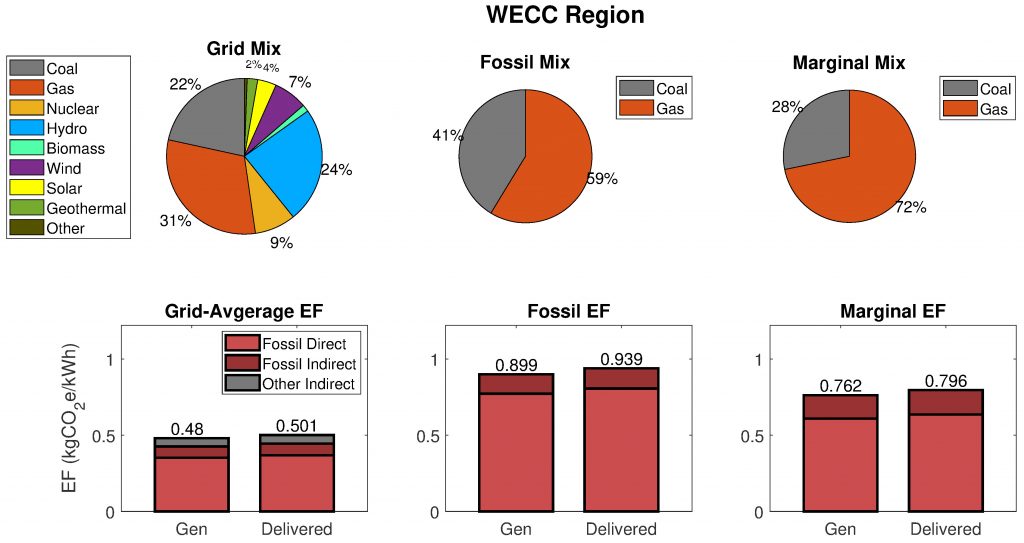
Figure 8. From left to right, for the WECC region, we have the mix of all generation sources and associated EFs, the mix of fossil resources and related EFs, and finally the marginal generating mix and EFs.
Additional references
[1] Siler-Evans, K., Azevedo, I. L., & Morgan, M. G. (2012). Marginal emissions factors for the US electricity system. Environmental science & technology, 46(9), 4742-4748.
What is the date of this posting? How best to cite?
Electricity Emissions Factors by Region, Part 1: Background and the Western Region
In Las Vegas, keywords like “DUI Lawyer” and LSIs
such as “Best DUI Attorney” or “Expert DUI defense attorneys” are vital
for law practices specializing in DUI cases. This is especially true in a city known for its lively nightlife, like Las Vegas.
Residents in neighborhoods like Amber Hills and Arts District seek skilled legal representation in such
matters.
Clark McCourt Criminal Lawyers, located in Las Vegas, NV, offers
just that. Founded in 1905, Las Vegas is a city with a
rich history. It features a population of 646,790 (as of 2021) and houses 240,462 households.
The Las Vegas Beltway, a significant highway, serves the city, enhancing its transport infrastructure.
In Las Vegas, attorney costs for DUI cases can differ, considering the severity of the case.
The city experiences considerable temperature variations,
with warm summers and cool winters.
Visitors and residents alike visit points of interest such as AREA15 and the Bellagio Fountain. AREA15, for instance, is an innovative entertainment complex offering interactive experiences, while the Bellagio Fountain is famous for its stunning water shows.
Choosing Clark McCourt Criminal Lawyers is a wise decision for individuals in Las Vegas dealing with DUI charges.
Their proficiency in navigating such cases, combined with their familiarity of the local jurisdiction, makes them an ideal choice for individuals of this vibrant city.
Introducing Tyler Wagner: Allstate Insurance, your premier
insurance agency located in Las Vegas, NV. With years
of experience in the insurance industry, Tyler Wagner and his team are
committed to offering exceptional customer service and comprehensive insurance solutions.
Whether you’re looking for auto insurance or home insurance, to life and business insurance, we’ve got you covered.
Our wide range of coverage options guarantees that you
can find the perfect policy to protect what matters most.
Recognizing the need for risk assessment, we strives to provide
personalized insurance quotes that reflect your unique situation. By
leveraging our deep knowledge of the insurance market and advanced underwriting processes, Tyler
Wagner ensures that you receive fair premium calculations.
Navigating insurance claims can be challenging, but our agency by your side,
you’ll have a smooth process. Our efficient claims processing system and dedicated
customer service team ensure that your claims are processed efficiently and compassionately.
In addition, we are well-versed in insurance law and regulation,
ensuring that our policies are consistently in compliance with the latest legal standards.
Our knowledge offers an added layer of security to our
policyholders, knowing that their insurance policies are robust and reliable.
At Tyler Wagner: Allstate Insurance, we believe that insurance is more than just a policy.
It’s a critical tool for protecting your future
and securing the well-being of those you care
about. That’s why, we take the time to understand your individual needs and
guide you through the choice among insurance options, making sure that you are well-informed
and confident in your decisions.
Selecting Tyler Wagner: Allstate Insurance means partnering with
a trusted insurance broker in Las Vegas, NV,
who prioritizes your peace of mind and excellence. Our team isn’t
just here to sell policies; we’re your partners in building
a protected future.
Don’t wait to contact us today and discover how Tyler Wagner: Allstate Insurance can elevate your insurance experience in Las Vegas, NV.
Experience the difference of working with an insurance agency that truly cares about
your needs and is dedicated to ensuring your peace of mind.
What’s up to every body, it’s my first go to see of this weblog; this website
carries remarkable and truly excellent information in favor of
readers.
Wonderful write-up… Your perspective is refreshing. Thanks for sharing
Hello, its good piece of writing on the topic of media print, we all understand media
is a enormous source of facts.
Yes! Finally something about sex education.
Thanks for sharing your thoughts about tips for cruising.
Regards
This is very interesting, You’re a very professional blogger.
I have joined your feed and look forward to looking for extra of your
fantastic post. Additionally, I have shared your site in my social
networks